fbpixel

Tri Cities

Tri-Cities Real Estate Market Update: Changes in New Listings Over the Past Four Months

Tri-Cities Real Estate Market Update: Changes in New Listings Over the Past Four Months – February 2025

The number of homes entering the market is a key indicator of supply and demand dynamics in real estate. A rising number of listings typically signals more opportunities for buyers, while a decline can create more competition and drive up prices. By analyzing how new listings have changed over the last four months, we can […]

Tri-Cities Real Estate Market Update: Changes in New Listings Over the Past Four Months – February 2025 Read More »

Tri-Cities Real Estate Market Update: Is It a Buyer’s or Seller’s Market?

Tri-Cities Real Estate Market Update: Is It a Buyer’s or Seller’s Market? – February 2025

The balance between buyers and sellers is constantly shifting in real estate. By analyzing buyer and seller scores, we can determine who holds the advantage in the current market. Higher seller scores indicate stronger conditions for sellers, while higher buyer scores suggest buyers have more negotiating power. This report looks at West Richland, Richland, Pasco,

Tri-Cities Real Estate Market Update: Is It a Buyer’s or Seller’s Market? – February 2025 Read More »

Tri-Cities Real Estate Market Update: How Do Listing Prices Compare to Final Sale Prices?

Tri-Cities Real Estate Market Update: How Do Listing Prices Compare to Final Sale Prices? – February 2025

One of the best ways to understand real estate market trends is by analyzing how listing prices compare to final sale prices over different time frames. This can help buyers know how much they might expect to pay compared to the asking price, and it gives sellers insight into pricing strategies and market demand. This

Tri-Cities Real Estate Market Update: How Do Listing Prices Compare to Final Sale Prices? – February 2025 Read More »

Tri-Cities Real Estate Market Update: Price Per Square Foot Trends for New vs. Existing Homes – February 2025

Tri-Cities Real Estate Market Update: Price Per Square Foot Trends for New vs. Existing Homes – February 2025

When comparing new construction to existing homes, one of the most useful metrics is price per square foot. This figure helps buyers and sellers understand how much value they’re getting for their money and whether trends are favoring newer builds or resale homes. This analysis breaks down price per square foot trends for existing homes

Tri-Cities Real Estate Market Update: Price Per Square Foot Trends for New vs. Existing Homes – February 2025 Read More »

Tri-Cities Real Estate Market Update: Are More Homes Selling or Being Listed? – February 2025

Tri-Cities Real Estate Market Update: Are More Homes Selling or Being Listed? – February 2025

A key factor in real estate market trends is the balance between new listings and homes sold each month. When more homes are listed than sold, inventory grows, potentially creating a buyer’s market with more choices and negotiating power. Conversely, if sales outpace new listings, inventory shrinks, leading to a seller’s market where competition drives

Tri-Cities Real Estate Market Update: Are More Homes Selling or Being Listed? – February 2025 Read More »

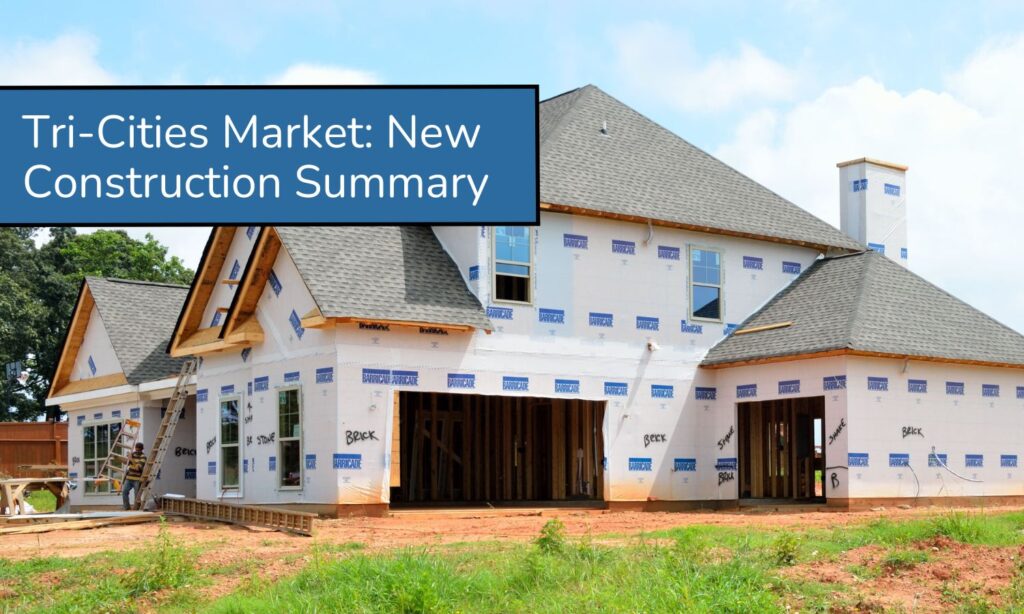
New Construction Tri-Cities Real Estate Market Summary Past 12 Months – February 4 2025

New Construction Tri-Cities Real Estate Market Summary: Past 12 Months – February 4 2025

The Tri-Cities real estate market for new construction homes has experienced notable trends over the past 12 months. This analysis focuses on single-family homes that were newly built and listed in the market, providing insights into inventory levels, pricing trends, and buyer-seller dynamics. Key Market Trends 1. Moderate Inventory with Steady Sales Over the past

New Construction Tri-Cities Real Estate Market Summary: Past 12 Months – February 4 2025 Read More »

Tri-Cities Real Estate Market Summary: Past 12 Months – February 4 2025

Tri-Cities Real Estate Market Summary: Past 12 Months – February 4 2025

Understanding real estate trends is crucial for both buyers and sellers. By analyzing the past 12 months of market activity in the Tri-Cities region, we can identify key trends in listings, pricing, and market speed. This report will provide an in-depth look at how existing single-family homes have performed over the last year, helping you

Tri-Cities Real Estate Market Summary: Past 12 Months – February 4 2025 Read More »

Tri-Cities Real Estate Market Update: Trends in New & Existing Homes – February 2025

Tri-Cities Real Estate Market Update: Trends in New & Existing Homes – February 2025

Understanding how the real estate market is shifting is crucial for both buyers and sellers. Over the past 12 months, market trends have evolved across the Tri-Cities, impacting listing counts, sales activity, and pricing dynamics. This analysis will highlight the key changes in inventory levels, buyer and seller market conditions, and what these trends mean

Tri-Cities Real Estate Market Update: Trends in New & Existing Homes – February 2025 Read More »

Tri-Cities Market Update: All Existing Construction vs. All New Construction – December 18 2024

Tri-Cities Market Update: All Existing Construction vs. All New Construction – December 18 2024

Tri-Cities Real Estate Market Update: Existing Construction vs. New Construction The real estate market in the Tri-Cities has seen notable shifts over the past 12 months, driven by supply, demand, and economic factors. In this summary, we’ll examine the performance of existing construction homes and new construction properties, focusing on key statistics and market trends.

Tri-Cities Market Update: All Existing Construction vs. All New Construction – December 18 2024 Read More »

Best Price Ranges for Tri-Cities Home Buyers – January 20 2025

Best Price Ranges for Tri-Cities Home Buyers – January 20 2025

The Buyer’s Scores provide a snapshot of market conditions favoring buyers. Lower scores suggest tougher conditions for buyers, while higher scores indicate more favorable conditions. Buyer’s Scores by Price Range and Month Price Range Previous Month Current Month Change Trend $0 – $300,000 0.8 2.3 +1.5 Improving $300,000 – $400,000 1.5 1.0 -0.5 Worsening $400,000

Best Price Ranges for Tri-Cities Home Buyers – January 20 2025 Read More »