fbpixel
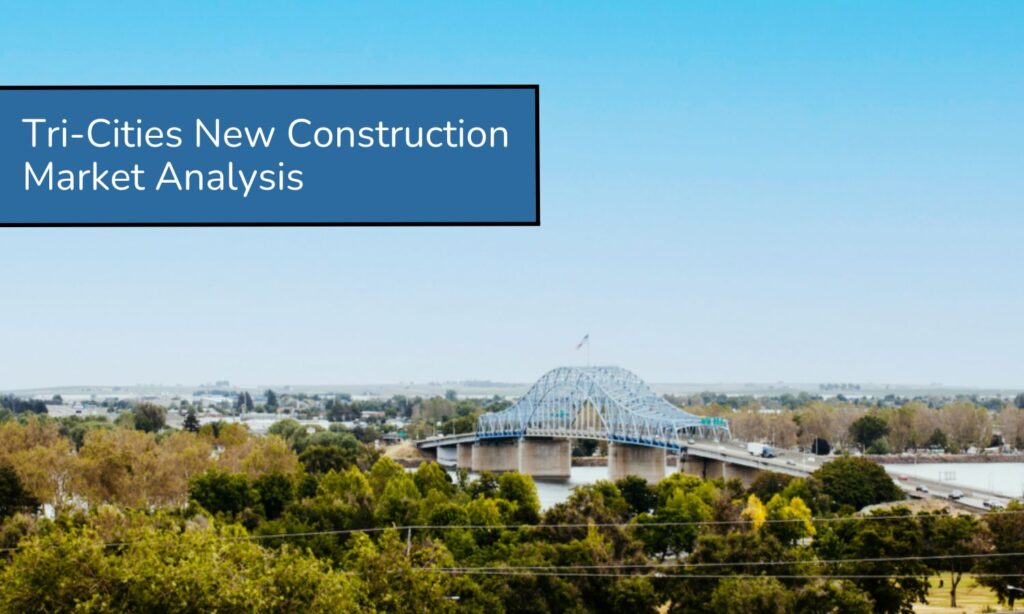
Tri-Cities New Construction Market Analysis - January 7 2025

Tri-Cities New Construction Market Analysis – January 7 2025

Interested in how the new construction market is performing? In this post, we analyze trends observed over the past 12 months and the last full month to give you a clear picture of market dynamics. Here’s what we’ll cover: Market speed for new construction homes in Tri-Cities Changes in days on market and listing prices

Tri-Cities New Construction Market Analysis – January 7 2025 Read More »
Tri-Cities Market Update: All Existing Construction vs. All New Construction – December 18 2024

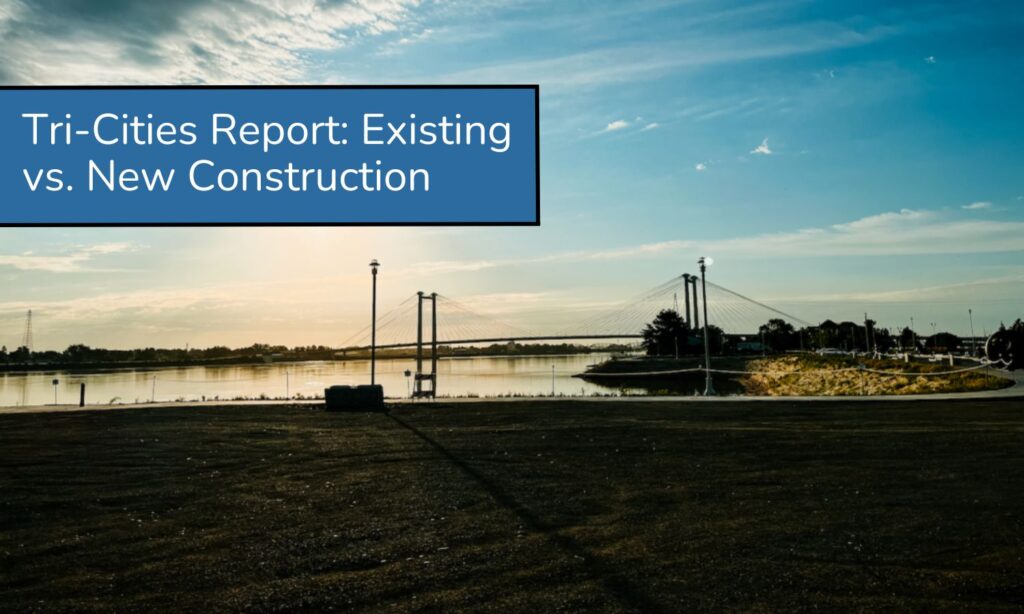
Tri-Cities Market Update: All Existing Construction vs. All New Construction – December 18 2024

Tri-Cities Real Estate Market Update: Existing Construction vs. New Construction The real estate market in the Tri-Cities has seen notable shifts over the past 12 months, driven by supply, demand, and economic factors. In this summary, we’ll examine the performance of existing construction homes and new construction properties, focusing on key statistics and market trends.

Tri-Cities Market Update: All Existing Construction vs. All New Construction – December 18 2024 Read More »

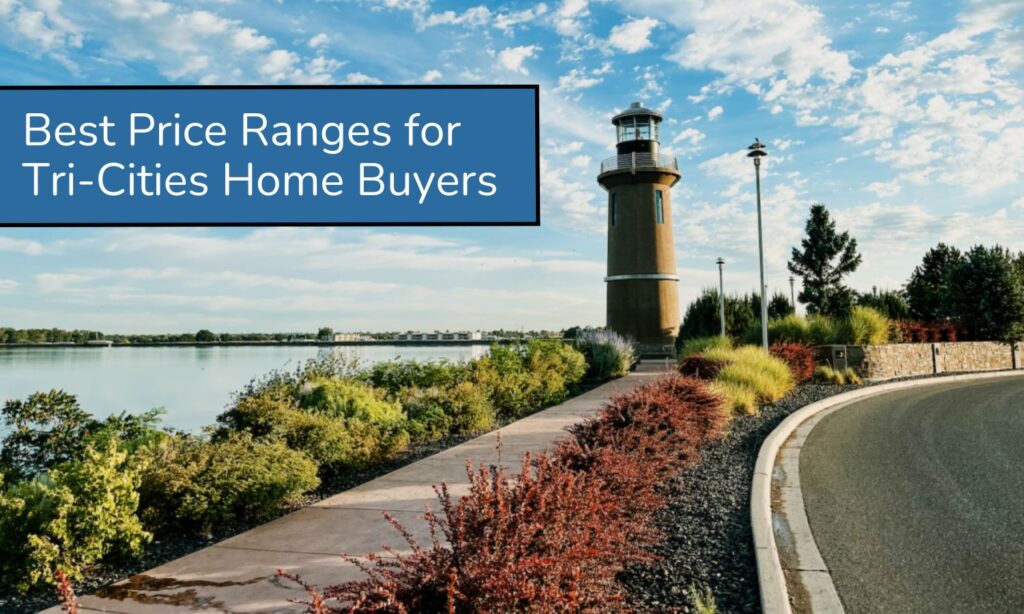
Best Price Ranges for Tri-Cities Home Buyers – January 20 2025

Best Price Ranges for Tri-Cities Home Buyers – January 20 2025

The Buyer’s Scores provide a snapshot of market conditions favoring buyers. Lower scores suggest tougher conditions for buyers, while higher scores indicate more favorable conditions. Buyer’s Scores by Price Range and Month Price Range Previous Month Current Month Change Trend $0 – $300,000 0.8 2.3 +1.5 Improving $300,000 – $400,000 1.5 1.0 -0.5 Worsening $400,000

Best Price Ranges for Tri-Cities Home Buyers – January 20 2025 Read More »

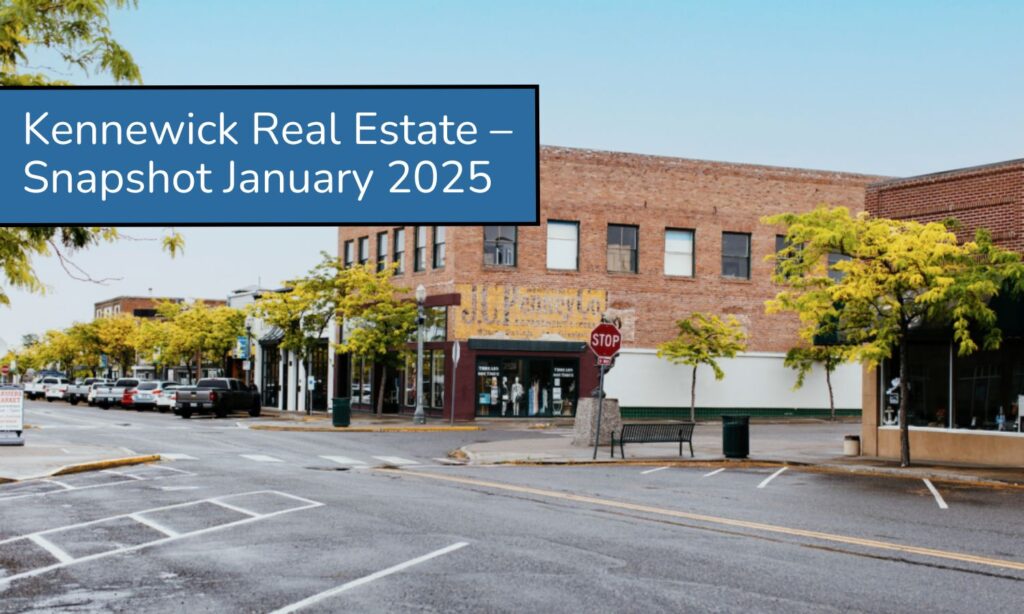
Kennewick Real Estate – Market Snapshot January 2025

Kennewick Real Estate – Market Snapshot January 2025

The Kennewick real estate market shows interesting trends based on various metrics, such as the speed of the market, price changes, and average days on market. This summary analyzes data from four time periods: the past 12 months, the current year to date (YTD), the last full month, and the current month. It also highlights

Kennewick Real Estate – Market Snapshot January 2025 Read More »

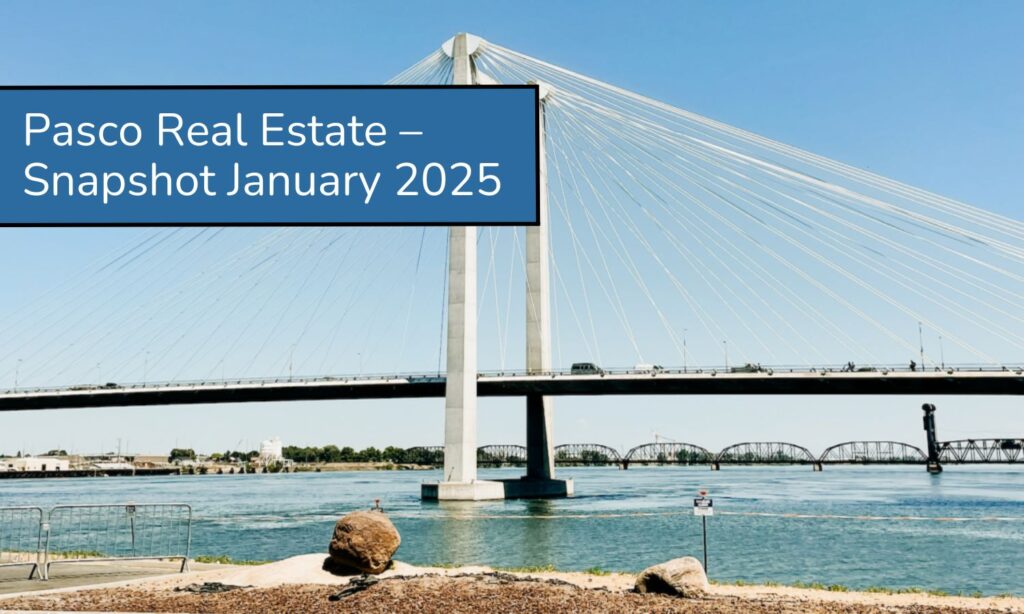
Pasco Real Estate – Market Snapshot January 2025

Pasco Real Estate – Market Snapshot January 2025

The real estate market in Pasco offers unique opportunities for both buyers and sellers. By analyzing data from the past 12 months, year to date (YTD), the last full month, and the current month, we can understand market trends and predict future patterns. This analysis focuses on single-family homes in Pasco, Washington, looking at listings,

Pasco Real Estate – Market Snapshot January 2025 Read More »

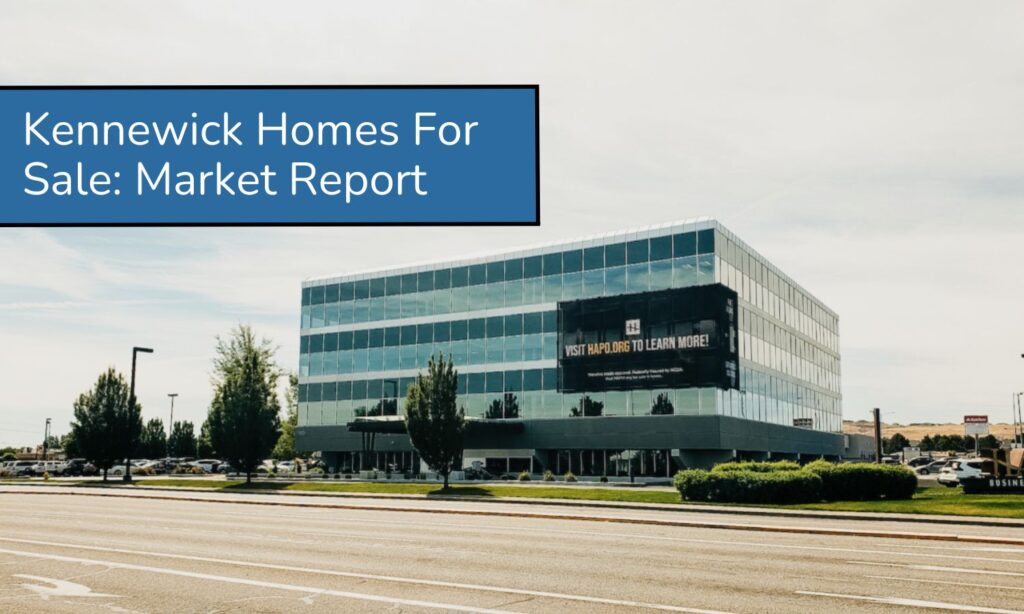
Kennewick Homes For Sale: Market Report

Kennewick Homes For Sale: Market Report 400,000 to 500,000

The Kennewick real estate market is bustling with activity, offering exciting opportunities for both buyers and sellers. By analyzing data from the past 12 months, year to date (YTD), the last full month, and the current month, we can uncover important trends in home listings, sales, and prices. This analysis focuses on single-family homes in

Kennewick Homes For Sale: Market Report 400,000 to 500,000 Read More »

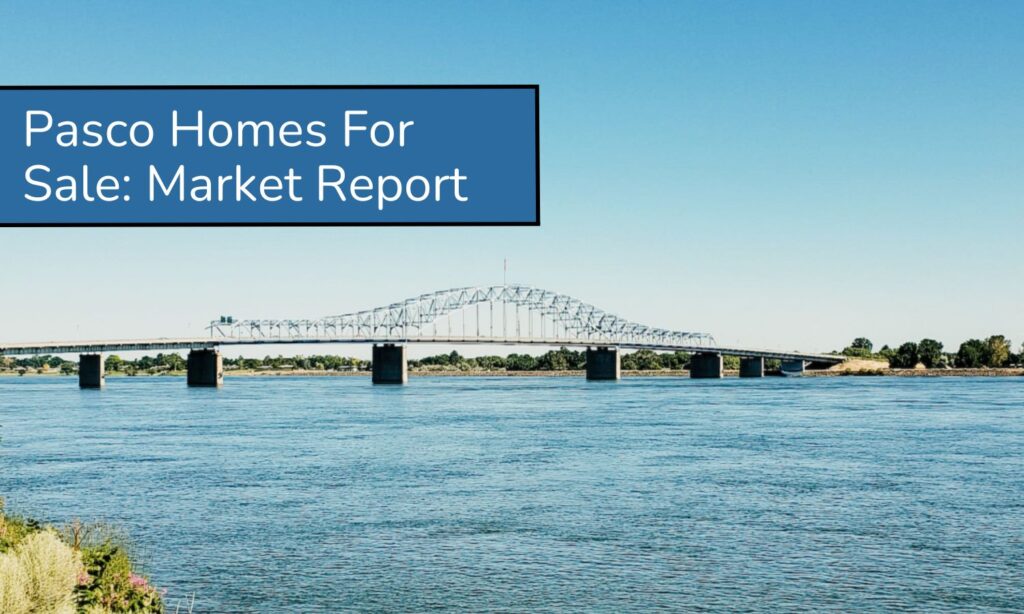
Pasco Homes For Sale: Market Report

Pasco Homes For Sale: Market Report 400,000 to 500,000

The Pasco real estate market is thriving, presenting excellent opportunities for both buyers and sellers. By analyzing data from the past 12 months, year to date (YTD), the last full month, and the current month, we can identify key trends in home listings, sales, and prices. This analysis focuses on single-family homes in Pasco priced

Pasco Homes For Sale: Market Report 400,000 to 500,000 Read More »

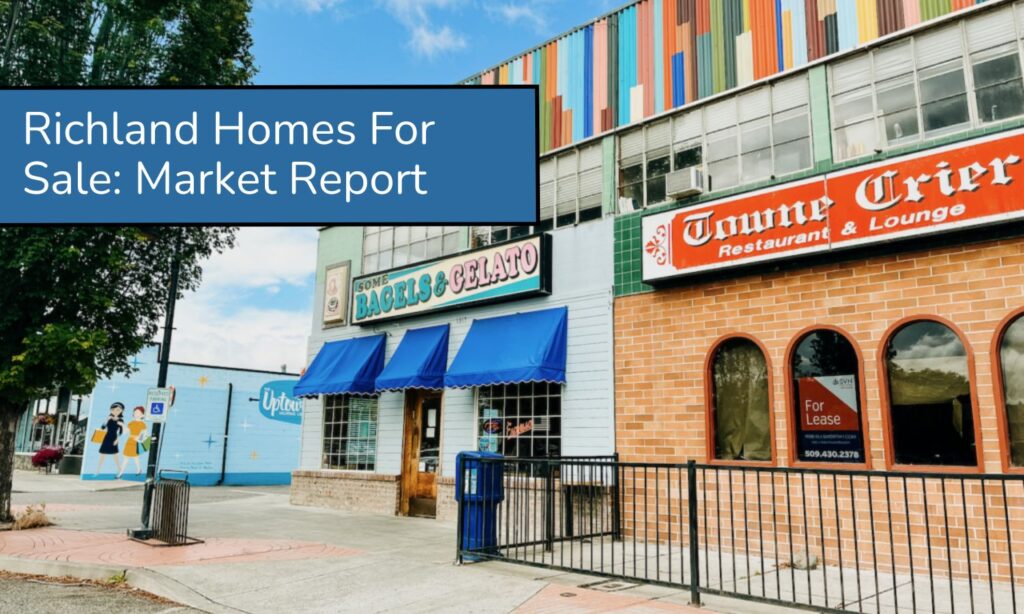
Richland Homes For Sale: Market Report

Richland Homes For Sale: Market Report 400,000 to 500,000

Richland’s real estate market is vibrant, providing great opportunities for both buyers and sellers. By analyzing data from the past 12 months, year to date (YTD), the last full month, and the current month, we can identify key trends and changes. This analysis focuses on single-family homes in Richland priced between $400,000 and $500,000. Past

Richland Homes For Sale: Market Report 400,000 to 500,000 Read More »

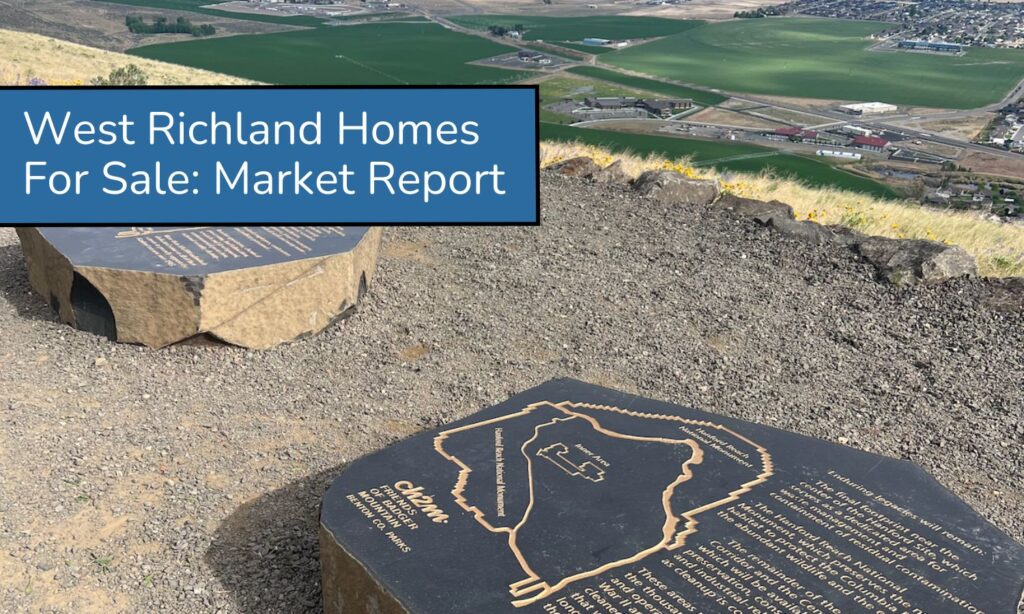
West Richland Homes For Sale: Market Report

West Richland Homes For Sale: Market Report 400,000 to 500,000

The West Richland real estate market offers exciting opportunities, especially for homes priced between $400,000 and $500,000. By analyzing data from the past 12 months, year to date (YTD), the last full month, and the current month, we can uncover key market trends in home listings, sales, and prices. This analysis focuses on single-family residences

West Richland Homes For Sale: Market Report 400,000 to 500,000 Read More »